
Want a peek behind the curtain of how well insurance brokerage competitors are tackling debt, covering expenses, or paying carriers? Even firms who believe they are handling these financial demands well take time to monitor their own performance in these areas and compare them to top firms. Measuring and comparing are powerful methods to confirm success and stay ahead of competitors.
From MarshBerry’s list of Critical Performance Indicators, here are some equity-based ratios top firms use to become stand-out performers and the key questions these metrics can answer.
Do the numbers cover the bills?
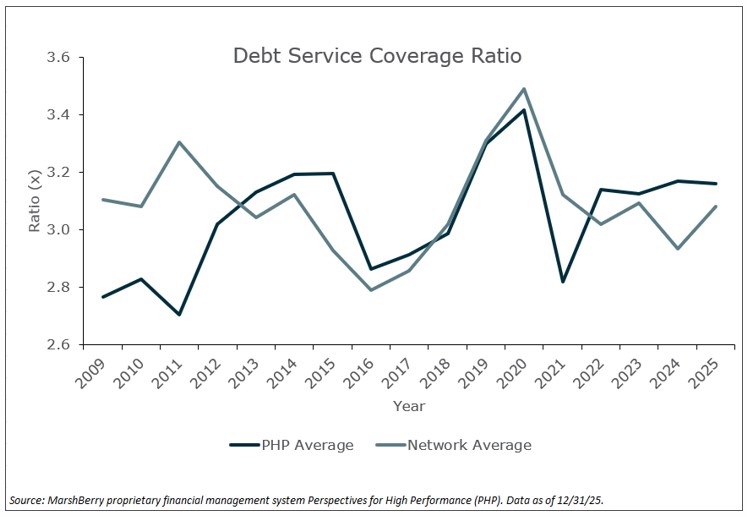
Debt Service Coverage Ratio (DSCR) compares the cash a business generates to what it must pay in the near-term. It is calculated as EBITDA (earnings before interest, taxes, depreciation, and amortization) divided by the current portion of long-term debt, plus annual interest expense. A higher DSCR indicates greater financial flexibility and stability. In the chart below, firms within MarshBerry’s Perspectives for High Performance (PHP) benchmark database (shown here as the PHP average) and firms in the Connect Network, MarshBerry’s Executive Peer Exchange, remained relatively stable between 2009 and 2025, generally ranging from 2.8x to 3.5x. A DSCR around 3.0x is healthy and provides flexibility for acquisitions, internal perpetuation financing, or growth investments.
Here are three ways to improve a low DSCR:
- Reduce debt: Pay down loans to lower required payments.
- Refinance or restructure: Extend terms, lower rates, or consolidate debt.
- Improve cash flow: Speed up invoicing, improve collections, streamline operations, and tighten inventory control.
How strong is the firm’s safety cushion?
A firm’s trust ratio measures how well an insurance brokerage can cover short-term obligations to carriers. It’s calculated by dividing average cash, investments, and insurance receivables by average payables to insurers. A higher ratio indicates stronger financial stability and cash management.
Here are three ways to improve trust ratio:
- Increase cash: Collect commissions faster, reduce unnecessary expenses, and maintain reserves.
- Strengthen investments: Hold funds in safe, liquid investments to boost available assets.
- Manage payables: Pay carriers on time while aligning payment timing with cash flow and carrier terms.
- Use premium finance companies: They pay the insurer and then collect the money from the customer instead of the agent collecting.
Could the firm weather a revenue slowdown?
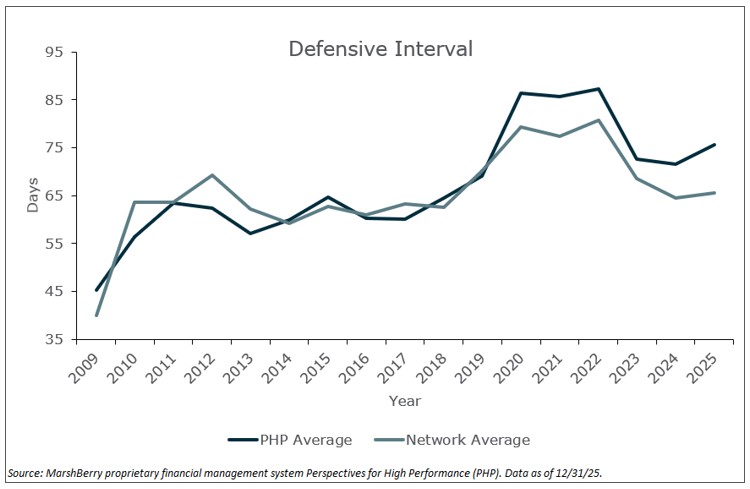
The defensive interval measures how many days a firm can cover expenses if revenue slows. It’s calculated by dividing net current assets (current assets minus current liabilities) by daily operating expenses. A higher value indicates stronger financial resilience. The chart below shows that since 2019 both PHP and the network average have been above 65 days, which is considered a good defensive interval. Under 45 days signals a potential for a weaker defensive interval with less cushion in times of volatility.
Here are three ways to improve defensive interval:
- Increase liquidity: Build current assets and reduce short-term liabilities.
- Lower expenses: Cut operating costs to reduce daily outflows.
- Strengthen cash flow: Improve cash management and reduce short-term obligations.
Why these ratios matter
Examining these metrics is a strategic lens into the health and direction of a business. Think of these as diagnostic metrics – they can help uncover inefficiencies, identify growth opportunities, and reveal gaps in resources. In fact, some firms like 2025 Regional MAX Performer Winner Starke Agency hired a leader to keep track of these types of ratios to feel more confident about their firms’ strategic bets. In short, strengthening cash flow, tightening expense control, and reducing short-term obligations will help firms maintain more days of financial protection if revenue slows down.
Are you ready to Connect?
You can learn even more about how to take advantage of CPIs by becoming a MarshBerry Connect member. Members gain access to exclusive market intelligence as well as an invaluable peer-to-peer exchange network. Learn more here.