Performance Benchmarking
Think Data & Analytics. Think Best Practices.

Understanding trends & data to improve your business
Transforming your firm through industry and peer perspectives
While some vendors can provide a slice of a point-in-time data, MarshBerry’s analysts and consultants partner with your leadership to look at the holistic performance of your firm through MarshBerry proprietary Perspective for High Performance (PHP).
With over 40 years of data, this apples-to-apples comparison of your balance sheet and income statement is used to help you:
- Discover weaknesses, opportunities, and areas in need of improvement.
- Identify trends that require immediate attention.
- Define actionable strategies that can integrate into the annual strategic planning process.
- Set agency, management, and departmental performance goals.
- Measure success with peer performance benchmarks.
- Receive seamless delivery through MarshBerry’s leading-edge Value Intelligence Portal (VI Portal).
- Keep informed of industry trends and performance.
Measuring Your Performance
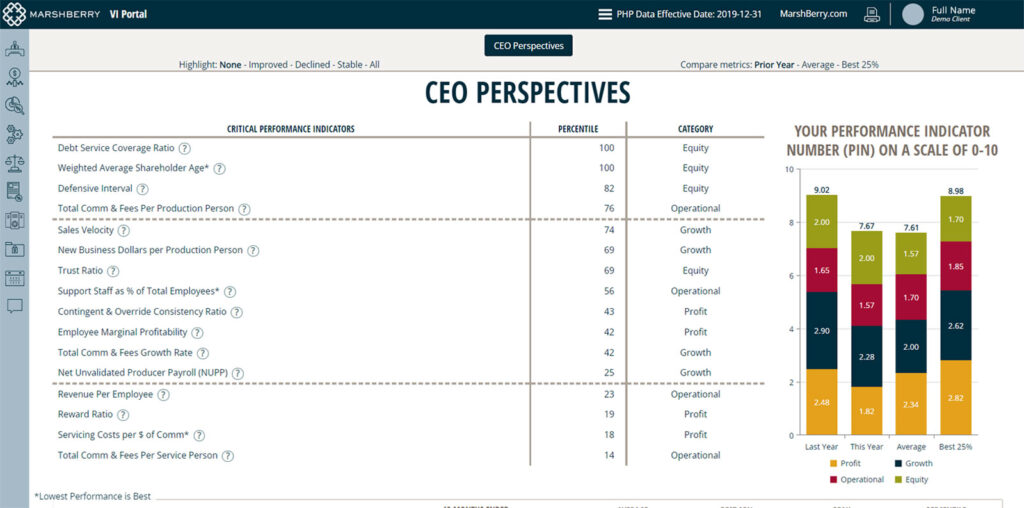
MarshBerry’s 16 Critical Performance Indicators are metrics used to benchmark agency and brokerage performance. They measure key ratio around profit, operations, growth and equity – helping firms identify gaps, track progress, and align strategy with top-quartile industry standards. Ratios are compared to Average Performance and Best 25% of the data set. Performance is ranked and weighted to determine a Performance Indicator Number (PIN). According to historical data, agencies, and brokerages that perform well (e.g. have a high PIN) tend to have a higher firm value.
Profit Perspectives
Analysis of income statement revenue and expenses on a line–by–line basis and highlights key profitability metrics to indicate the reliability of the earnings potential.
Equity Perspectives
Proficiency in managing the balance sheet, including asset management and collection performance.
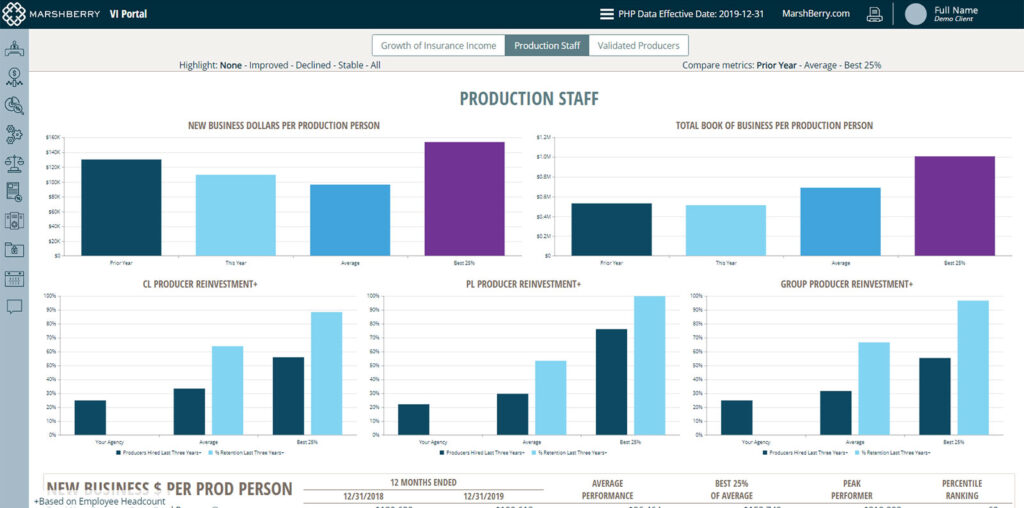
Growth Perspectives
Analysis of the firm’s sales engine and benchmarking producer performance.
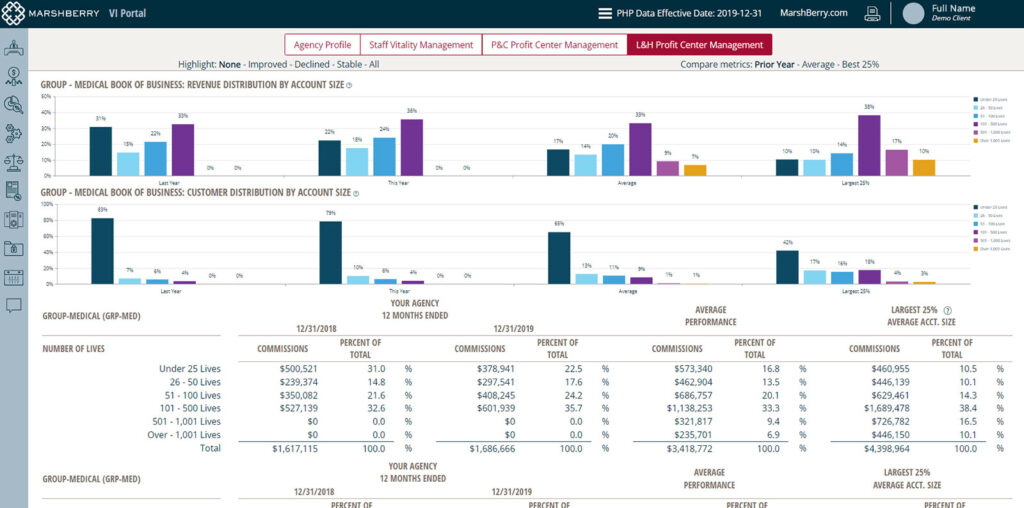
Operational Perspectives
A measure of the ability to leverage employees to sustain growth in earnings and set goals to improve employee productivity by department.
CEO Perspectives
Executive summary and overall performance indicator ranking based on the 15 Key Ratios. A well–balanced representation of all the measurable disciplines we believe are necessary to manage an insurance agency successfully.