
2022 was a year of challenging headwinds for M&A activity. With the backdrop of global macroeconomic hardships including record inflation, a slowing economy, labor shortages, and the Federal Reserve (Fed) raising interest rates to its highest level in 15 years – the insurance brokerage M&A landscape had an uphill battle from the start. It didn’t help that 2021 set new records and was the fifth straight year for highs in M&A deals and valuation multiples. 2022 was also disadvantaged by the number of deals closed in Q4 2021 – driven by sellers that were concerned about a potential federal capital gains tax increase in 2022. This resulted in many transactions that would have normally closed in Q1 of 2022 to be rushed over the finish line before year-end. Expectations for 2022 were tempered.
But despite the hurdles, 2022’s final deal count will likely qualify as the second-highest year on record – which is not bad, considering.
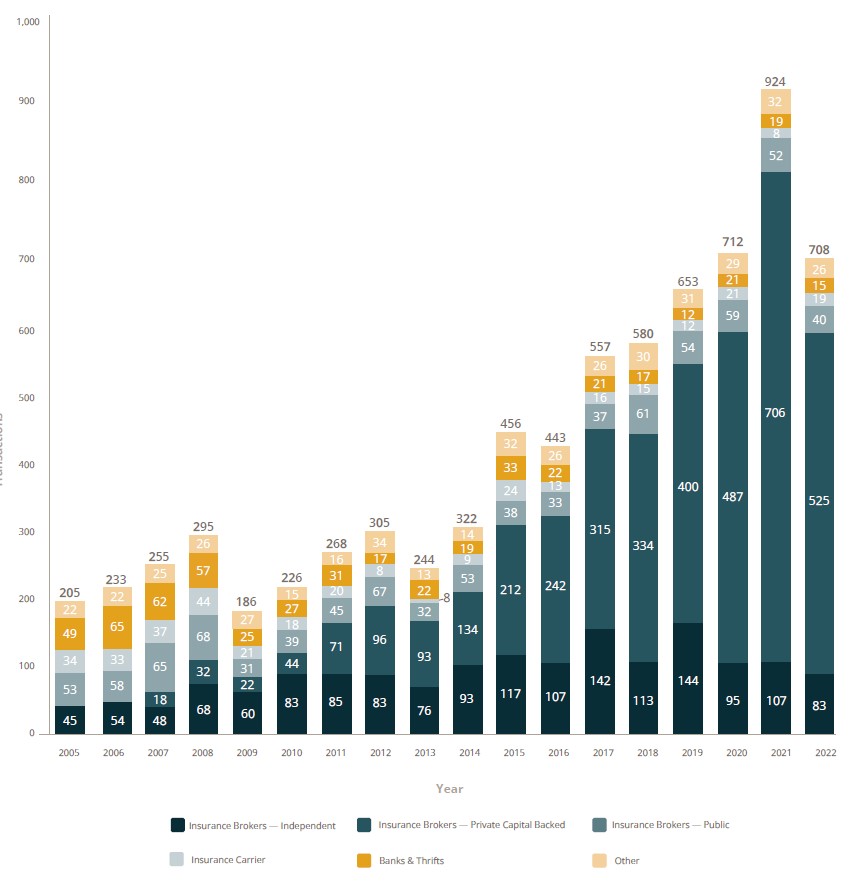
As of January 3, 2023, there were 708 announced M&A transactions in the U.S. in 2022. This represents a 23.4% decrease compared to 2021 and a Compound Average Growth Rate (CAGR) of 5.1% since 2018. When the dust settles and all deals are announced, it will likely be the second highest year on record behind 2021, eclipsing the 2020 total of 712 announced transactions.
Private Capital backed buyers accounted for 525 of the 708 transactions (74.2%) in 2022, as they continued expanding their presence in the marketplace. Independent agencies accounted for 83 (or 11.7%) of the total deal count, while deals involving specialty distributors as targets accounted for 22.5% of the total 708 deals in 2022. Specialty firm deals increased by a CAGR of 21.9% since 2018, a trend that is anticipated to continue as traditional retail brokers expand into the wholesale and delegated authority space.
The top ten most active buyers accounted for 345 of the 708 transactions (48.7%), while the top three (Acrisure, LLC, Hub International Limited, and Peter C. Foy & Associates Insurance Services, LLC) accounted for 19.8% of total transactions.
Valuations Remain Strong Despite the Economy
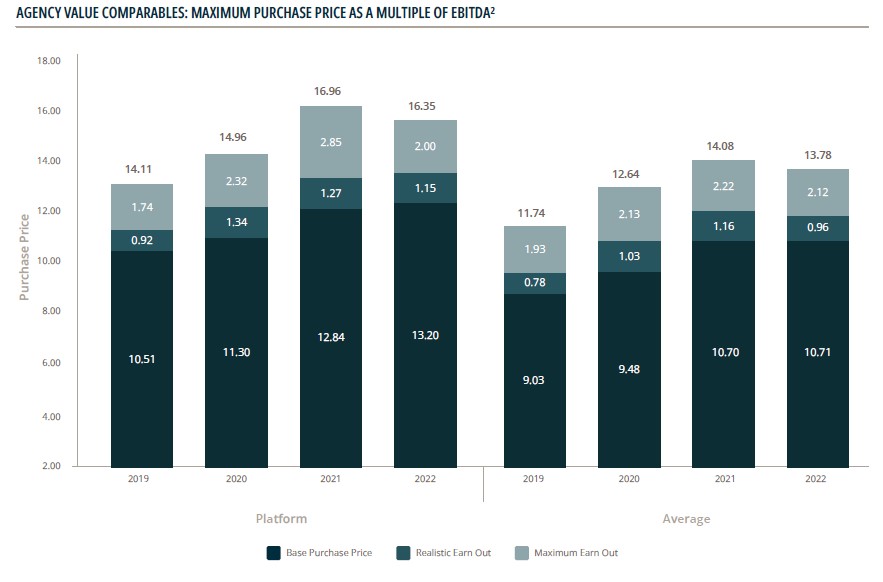
Even as the 2022 financial markets saw the worst year since 2008, valuations in the insurance distribution sector for 2022 were still very strong, even compared to the record-breaking multiples of 2021. Valuations on guaranteed base purchase price for average firms in 2022 was essentially flat compared to 2021 (going from 10.70x to 10.71x). But platform deals saw an increase in valuations on guaranteed base purchase price (going from 12.84x to 13.20x). Guaranteed base purchase price is defined as the amount of proceeds paid at closing plus amounts that the buyer may initially hold back, but which are paid as long as the sellers performance does not materially decline.
Are we seeing the peak for valuations? Maybe for average firms. Yet, despite the S&P 500 dropping 20% in 2022 – valuations for average-sized insurance brokers remain close to record highs, with platform firms setting a new record for valuation multiples.
What does all this mean? It means buyers are still willing to pay higher multiples for high-performing platform organizations.
The Debt Markets Starting to Impact Parity in Supply & Demand
Through the year, as the debt markets tightened, there has been an equalization in the supply and demand in the insurance brokerage space. Sellers have enjoyed several years of premium valuations, as buyer demand outnumbered available sellers. But now, as debt becomes more expensive or even unavailable, some buyers have decided to sit on the sidelines, making the M&A field a bit more level. We still see demand to be outpacing supply, but not by as large of a margin as in prior years. There are still approximately 35+ well-capitalized buyers who are still active in the market, are looking for the best firms and appear willing to pay record level multiples to get them.
What does that mean for firms looking to partner? It means the environment has become a bit more challenging and buyers have the luxury of digging deeper into firm valuations. Multiples are still important, but how you are getting to an EBITDA (Earnings Before Interest, Taxes, Depreciation & Amortization) margin that everyone can agree to as fair, is no longer cut and dry. There is a tremendous advantage, even more than ever, of having a firm like MarshBerry in your corner to help you maximize your value.
Anticipating More M&A Transactions in 2023
There are plenty of reasons to be optimistic in 2023. Despite the Fed’s continued (and understandable) efforts to curb inflation through increased interest rate hikes, this is still an industry that is resilient and robust. There are still lots of firms looking to invest in this space and valuations continue to remain high, despite a leveling playing field and rising cost of debt. MarshBerry is keeping a close eye on the economy and how the Fed’s decisions are affecting the debt markets. But the world isn’t coming to a screeching halt. In fact, there is more opportunity than ever for agencies and brokers to realize their peak value and seek an adviser to help them through the biggest decisions of their lives.
MarshBerry is excited to announce it has completed 105 M&A transactions (62 sell side, 43 buy side) in 2022. Our firm continues to remain the number one sell side advisor for the 24th year in a row and retains the top spot in the industry for total number of clients advised.
If you have questions about Today’s ViewPoint or would like to learn more about M&A activity for insurance agents and brokers, please email or call Phil Trem, President – Financial Advisory, at 440.392.6547.
Investment banking services in the USA offered through MarshBerry Capital, LLC, Member FINRA and SIPC, and an affiliate of Marsh, Berry & Company, LLC, 28601 Chagrin Blvd, Suite 400, Woodmere, OH 44122 (440) 354-3230
1Data pulled as of January 3, 2022. All transactions are announced deals involving public companies, Private Capital backed brokers, private companies, banks as well as others including Private Capital groups, underwriters, specialty lenders, etc. All targets are U.S. only. This data displays a snapshot at a particular point in time and has not necessarily been updated to reflect subsequent changes in prior years, if any. MarshBerry estimates that historically, a low percentage of transactions were publicly announced, but we believe that this has risen to over 50% today. Source: S&P Global Market Intelligence, Insurance Journal, and other publicly available sources.
2Source: MarshBerry proprietary database. Data compiled from transactions in which we were directly involved, those from which we have detailed information, and transactions in the public record. Numbers may not add due to rounding. Past performance is not necessarily indicative of future results. Individual results may vary.
EBITDA: Earnings Before Interest, Taxes, Depreciation, and Amortization.
Base Purchase Price: The amount of proceeds paid at closing, including any escrow amounts for indemnification items, (i.e., Paid at Close) plus amounts that the buyer may initially hold back, but which are paid as long as the seller’s performance does not materially decline, or which may be paid at closing but are subject to a potential adjustment (i.e., Live Out).
Realistic Earn Out: The amount of proceeds realistically anticipated to be achieved in the future based on a number of factors including seller historical and expected performance, buyer and seller realistic discussion of earn out metrics, etc.
Maximum Earn Out: The additional earn out above the realistic level, that if achieved, would generate the maximum possible earn out payment.
Platform: High level transaction for a buyer, typically due to new geography niche, expertise, size, talent, etc.
Disclosure: All deal count metrics are inclusive of completed deals with U.S. targets only. Scorecard year-to-date totals may change from month to month should an acquirer notify MarshBerry or the public of a prior acquisition. 2022 statistics are preliminary and may change in future publications. Please feel free to send any announcements to M&A@MarshBerry.com.
Source: S&P Global Market Intelligence, http://www.insurancejournal.com, http://www.businessinsurance.com/ and other publicly available sources.