
The fourth quarter begins amidst a turbulent year for the overall U.S. and global economies, where inflation, rising interest rates, and stock market volatility are dominating the financial news. However, merger & acquisition (M&A) activity in the insurance brokerage space continues to be very active, with average valuation multiples seeing another increase through the third quarter. As of September 30, 2022, there have been 405 announced M&A transactions in the U.S., a 23% decrease compared to this time last year. However, the anticipated rate at which deals are announced will increase in Q4 — ultimately shortening the gap between 2021 and 2022.
Capital backed brokers continue to be the dominant buyers and accounted for 310 (or 76.5%) of the total transactions through September. These firms are displaying a capacity to continue buying at a steady pace and eager to deploy available dry powder …. for now. The insurance distribution industry continues to be a highly sought-after investment as it appears the market is heading toward a prolonged period of economic stagnation.
Deals involving specialty distributors as targets currently account for 26% of the total deals year–to–date. This trend is anticipated to continue as traditional retail brokers expand into the wholesale and delegated authority space. Public brokers have remained consistent with last year in terms of total deal count, making up 6.2% of total announced transactions.
Multiples
The average total potential deal value for the last twelve months (LTM) ending Q3 2022 is 14.56x Earnings Before Interest, Tax, Depreciation, and Amortization (EBITDA). Comparing this figure to year end 2021, which produced an average total potential deal value of 14.08x EBITDA, maximum valuations saw an increase of 0.48x EBITDA in the last 12 months. This represents a 3.4% increase. Compare this to the prior period — where valuations saw a 1.44x EBITDA increase in 2021 (over 2020), representing an 11.4% increase.
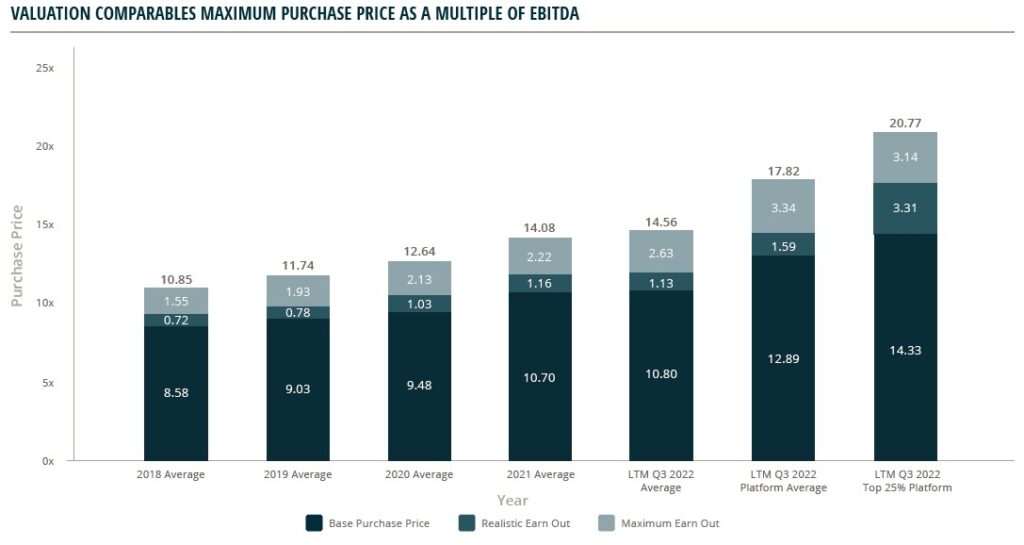
While the average deal is topping out at 14.56x EBITDA, Platform deals in the last twelve months continue to push even higher. The average of the Top 25% of Platform transactions are commanding close to 14.33x EBITDA on a Base Purchase Price with a maximum transaction value averaging over 20x EBITDA. There are numerous additional deals slated to close in Q4 2022 that have valuations that will likely top these trailing values.
Many buyers remain well capitalized with dry powder raised prior to the Fed raising rates to stave off inflation, however there are indications that some buyers are staying out of the market because the cost of debt is too high or just unavailable. They are choosing to sit on the sidelines instead of borrowing at the new interest rates. Most have capital that will support them well into spring/early summer 2023 if they continue at their current pace of buying. However, a significant slow down might be seen if markets don’t loosen up by the second quarter of 2023.
If you’d like to learn more about M&A activity for insurance agents or brokers, please email or call Phil Trem at 440.392.6547.
Investment banking services offered through MarshBerry Capital, LLC, Member FINRA Member SIPC and an affiliate of Marsh, Berry & Company, LLC. 28601 Chagrin Boulevard, Suite 400, Woodmere, Ohio 44122 (440.354.3230)