
Another Record Year for the Insurance Distribution Industry
Merger and Acquisition (M&A) activity continued at a rapid pace in 2021 and the industry has set another high watermark with 798 transactions announced as of 1/3/22. This is the fifth straight year of hitting a record high in deal count and it seems as though we may never reach a peak in activity (or valuations). While there will inevitably be more announcements in the coming weeks for December transactions, activity in 2021 has already dwarfed prior years. The blistering pace of transactions in 2021 represents a 12.2% increase compared to the 2020 announced deal tally of 711.
Announced M&A Transactions By Buyer Type1
The heightened M&A activity can be traced back to a number of different factors. Firms who sold believed that they might be negatively impacted by a potential federal capital gains tax increase and a shift in expectations by the insured community. While tax legislation was not enacted in 2021, there are still looming concerns that it could happen at some point in 2022. Will it be retroactive? Anything is possible, but at this point concern about a significant tax increase has waned.
One major driver of sellers coming to the table is an evolving expectations of brokers’ clients – the buyers of insurance. Since the beginning of the pandemic, insureds have created an expectation that their broker act as a consultant, not just someone who helps purchase insurance coverages. The end client is looking for someone who can help provide strategic guidance, risk management, and/or mitigation services. This creates a conundrum for insurance brokers who must keep investing in tools, resources and talent in order to effectively compete. Independent brokers have to decide whether they want to use their cash flow to make these investments or partner with a firm that has already done it. The build versus join decision is bringing a lot of firms to the deal table. This dynamic is not going away and the market will likely continue to be very robust.
Buyers and investors are continuing to push their way into the marketplace
Buyers and investors are continuing to push their way into the marketplace. If anything, the pandemic reminded the financial community what a great investment the insurance distribution space is and that demand is greater than ever before. It is a very favorable seller’s market because there is still more demand than there is quality supply.
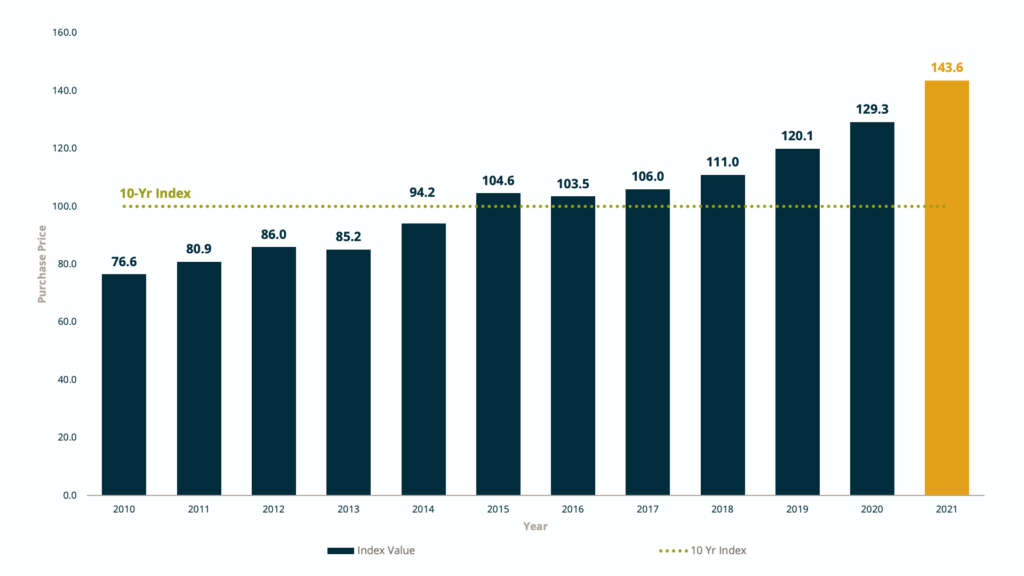
As with overall deal count, valuations saw yet another increase through the end of the year. The average base (or guaranteed) purchase price jumped to over 10x Earnings Before Interest, Taxes, Depreciation and Amortization (EBITDA), an increase of 12.9% over the upfront proceeds that sellers received in 2020. Valuation of buyers continues to rise, allowing these buyers to pay more and still realize multiple arbitrage on individual transactions. With the increased demand in the industry, there is still not enough supply to meet the appetite of all the industry’s investors. As a result, buyers are stepping up to offer higher valuations as the acquisition market remains very competitive. The total maximum purchase price has increased more than 11% year over year in 2021.
Maximum Purchase Price – EBITDA Multiple
While the 2022 deal count will not necessarily eclipse the 2021 total, activity will likely remain at the 2019/2020 levels with somewhere between 650-750 announced transactions. Activity in 1Q2022 is not likely to fade as it did in 2013 when pending tax increases caused a 2012 year-end sprint.
In 2021, Private Capital backed buyers accounted for 591 of the 798 transactions (74.1%), continuing to expand their presence in the marketplace. Total deals by these buyers has increased at a compound annual growth rate (CAGR) of 14.8% since 2018. Independent agencies accounted for 100 deals, or 12.5% of the total deal count. This portion of the total announced transactions is consistent with 2020, but experienced an overall decline since prior years. On average, from 2015-2020, 23.2% of deals done were completed by independent agencies.
2021 Acquisition Detail 2
- What’s Being Bought:
- Full Service: 175
- P&C: 508
- Employee Benefits: 115
- Retail vs. Specialty:
- Retail: 652
- Wholesale: 70
- MGA: 76
MarshBerry is excited to announce it advised more than 95 companies and completed 127 M&A transactions (80 sell side/47 buy side) in 2021, closing another record year for the firm. Our firm continues to remain the number one sell side advisor for the 23rd year in a row and retains the top spot in the industry for total number of clients advised.
If you have questions about Today’s ViewPoint, or would like to learn more about activity in the M&A marketplace, email or call Phil Trem, President – Financial Advisory, at 440.392.6547.
Subscribe to MarshBerry’s Today’s ViewPoint blog for the latest news and updates and follow us on social media.
1 Data pulled as of January 3, 2021. All transactions are announced deals involving public companies, Private Capital backed brokers, private companies, banks as well as others including Private Capital groups, underwriters, specialty lenders, etc. All targets are U.S. only. This data displays a snapshot at a particular point in time and has not necessarily been updated to reflect subsequent changes in prior years, if any. MarshBerry estimates that historically, a low percentage of transactions were publicly announced, but we believe that this has risen to over 50% today. Source: S&P Global Market Intelligence, Insurance Journal, and other publicly available sources.
2 Source: MarshBerry proprietary database. Data compiled from transactions in which we were directly involved, those from which we have detailed information, and transactions in the public record. Numbers may not add due to rounding. Past performance is not necessarily indicative of future results. Individual results may vary. Multiples calculated based on deals closed for each time period noted. 1. EBITDA: Earnings Before Interest, Taxes, Depreciation, and Amortization 2. Base Purchase Price: The amount of proceeds paid at closing, including any escrow amounts for indemnification items, (i.e., Paid at Close) plus amounts that the buyer may initially hold back, but which are paid as long as the seller’s performance does not materially decline, or which may be paid at closing but are subject to a potential adjustment (i.e., Live Out). 3. Maximum Earn Out: The additional earn out above the realistic level, that if achieved, would generate the maximum possible earn out payment. 4. 10 Year Index: Multiple calculated based on deals closed from 1/1/2010 to 12/31/2019.
Investment banking services offered through MarshBerry Capital, Inc., Member FINRA Member SIPC and an affiliate of Marsh, Berry & Company, Inc. 28601 Chagrin Boulevard, Suite 400, Woodmere, Ohio 44122 (440.354.3230)